Nuna
As a part of Nuna's Government Services Division we created an application
to process, error check, and warehouse Medicaid data from over 70 million lives from
50 states and 7 territories.
THE MANDATE
In 2013 the Centers for Medicare and Medicaid Services (CMS) mandated that all US states and territories start submitting their Medicaid data in the new standardized T-MSIS format. T-MSIS modernizes and enhances the way states will submit operational data about beneficiaries, providers, claims, and encounters and will be the foundation of a robust state and national analytic data infrastructure.
CHALLENGE
The data ingestion / cleaning portion of the submission process was the most urgent and core part of T-MSIS. CMS had struggled to ingest data from states, with the old system taking up to a week to process a 92GB file with no insight into the the status of the files being processed or acknowledgement of receipt. It was important for the new T-MSIS implementation built on Nuna’s stack to perform all state file ingestion quickly and reliably, so we could iterate quickly on data quality reporting and modeling for the data warehouse.
APPROACH
The old system was very slow, and tedious for states and technical assistance (TA) contractors to investigate and report problems. We wanted to be the opposite of this -- reduce the time necessary for a testing cycle and free up the TA team.
Our high level goals were to:
Make it easy for states to test and investigate problems on their own
Help CMS measure the quality of the data submitted and provide feedback
to states to improve data quality over timeProvide some tangible output for analysis
LEARNING
UNDERSTANDING A COMPLEX SYSTEM
Our first task was to understand the entire ecosystem. This included taking a look at the entire end-to-end process including the contents of the T-MSIS files as well as the data warehouse where they would eventually be stored. Users and subject matter experts were crucial to the discovery phase.
Operations Dashboard Diagram
UNDERSTANDING
CREATING PERSONAS
Since the ability to communicate with users directly was limited, it became even more important to use personas.
IDEATION
CREATING AN OUTLINE
After talking to users and studying the process it became clear the users could benefit from a much more robust application.
We saw an opportunity to create a powerful application that solved many problems.
WIREFRAMING
BRINGING IT TOGETHER
I started creating rough wireframes in Sketch just to organize the layout and user flow. With an application this complex
it's important to get the flow ironed out as early as possible.
LAYOUT
REFINING THE PROCESS
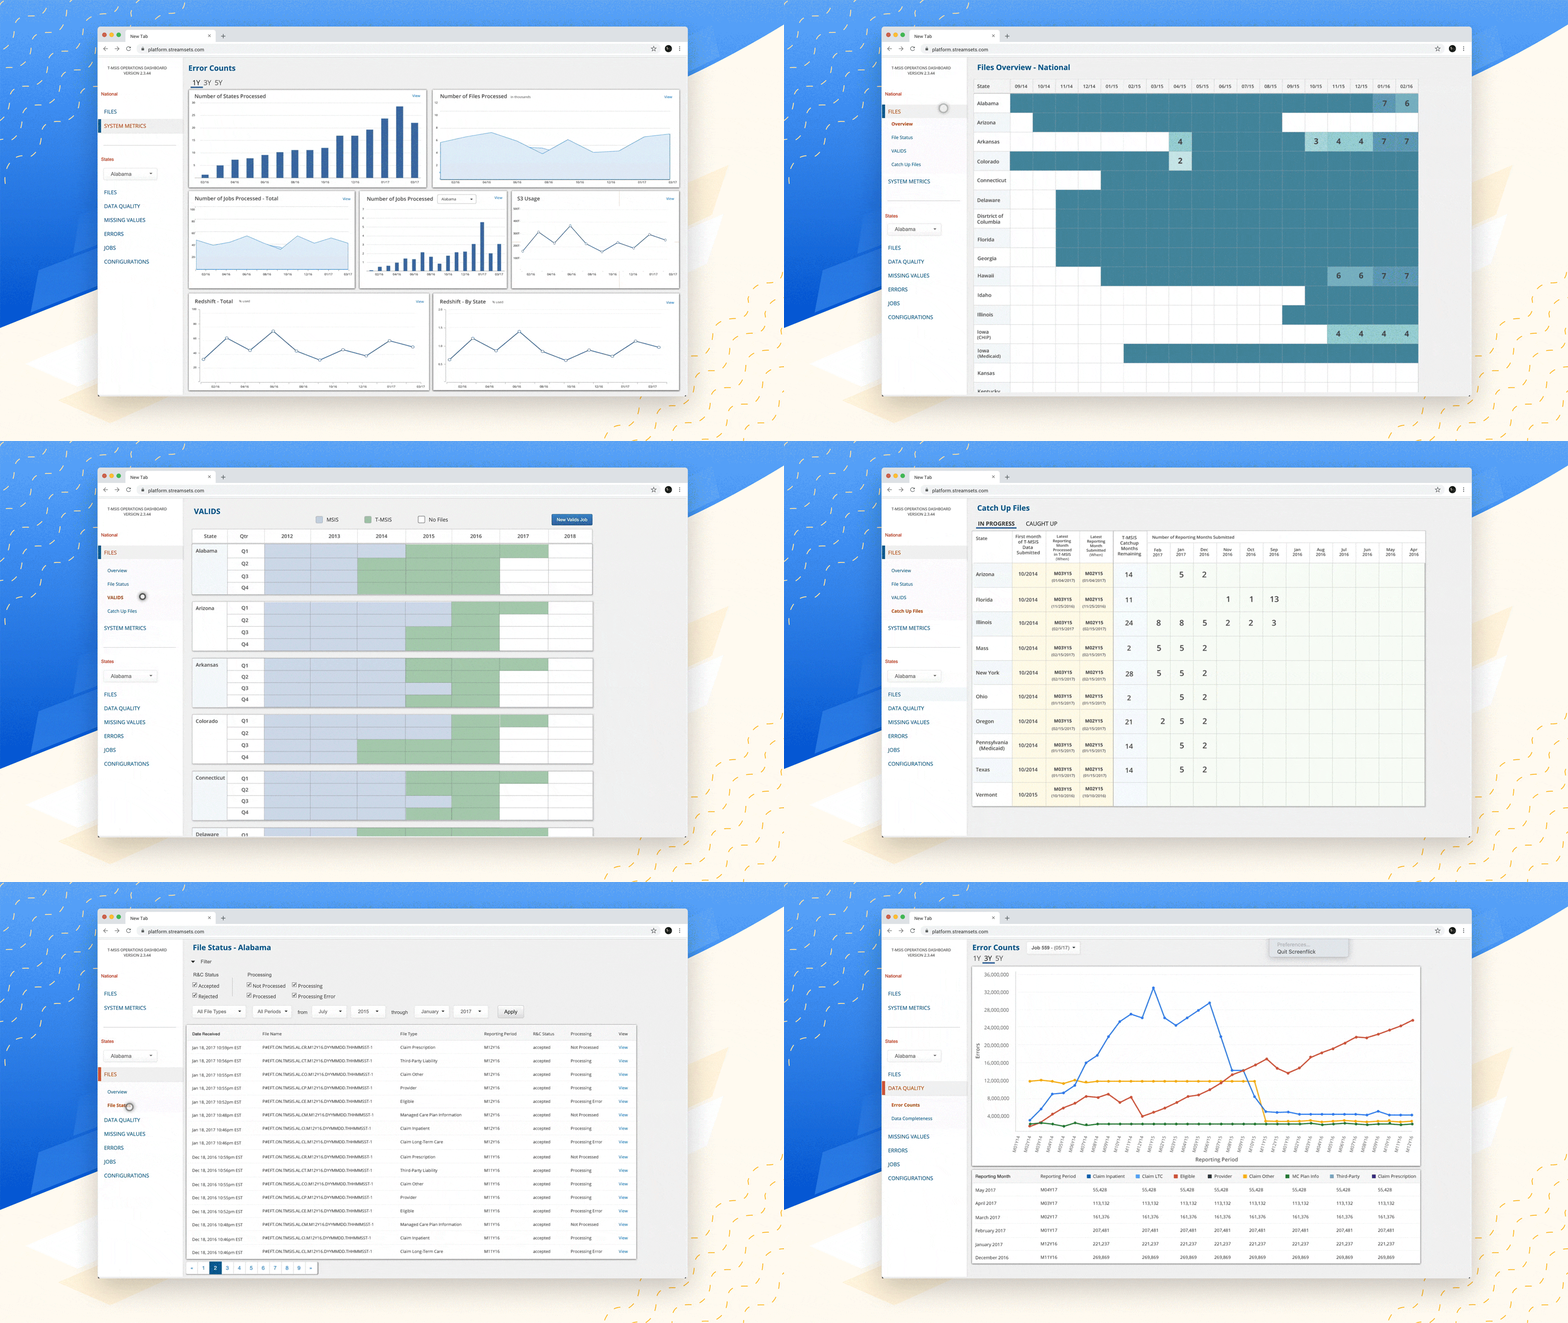
At this stage in the project it was obvious that the Operations Dashboard would continue to grow. I came up with a design that was easy to navigate through multiple levels of interaction yet was scalable enough to continue to expand through many new feature requests from CMS down the road.
FINISHED PRODUCT
For the final delivery of the Operations Dashboard, I flew to CMS headquarters in Baltimore to present the design to the
Data Operations leads. I used an Axure prototype that I had made to give them a realistic experience of the finished product.
It's no easy task to implement a new system for the federal government and all of the states. The Operations Dashboard was received exceptionally well
at the federal level as well as with the states.
As of writing this, 42 states are using the OD and have reached full production status.


